2021 캐글 대회 코드 작성기 - 2

Q3. In which country do you currently reside?


1
2
3
4
5
6
7
8
9
10
11
12
13
14
15
16
17
18
19
20
years = ['2019', '2021']
JP_country_count_19 = (df19[df19['Q3'] == 'Japan']['Q3']).count()
CN_country_count_19 = (df19[df19['Q3'] == 'China']['Q3']).count()
JP_country_count_21 = (df21[df21['Q3'] == 'Japan']['Q3']).count()
CN_country_count_21 = (df21[df21['Q3'] == 'China']['Q3']).count()

JP_country_count_19_21 = [JP_country_count_19, JP_country_count_21]
CN_country_count_19_21 = [CN_country_count_19, CN_country_count_21]

fig_country = go.Figure(data=[
go.Bar(name='Japan', x=years, y=JP_country_count_19_21, marker_color=JP_colors[0]),
go.Bar(name='China', x=years, y=CN_country_count_19_21, marker_color=CN_colors[1])
])
fig_country.update_layout(
barmode='group',
title_text='2019 & 2021, the number of Kaggler living in Japan and China',
xaxis_title='Years',
yaxis_title='Counts'
)
fig_country.show()

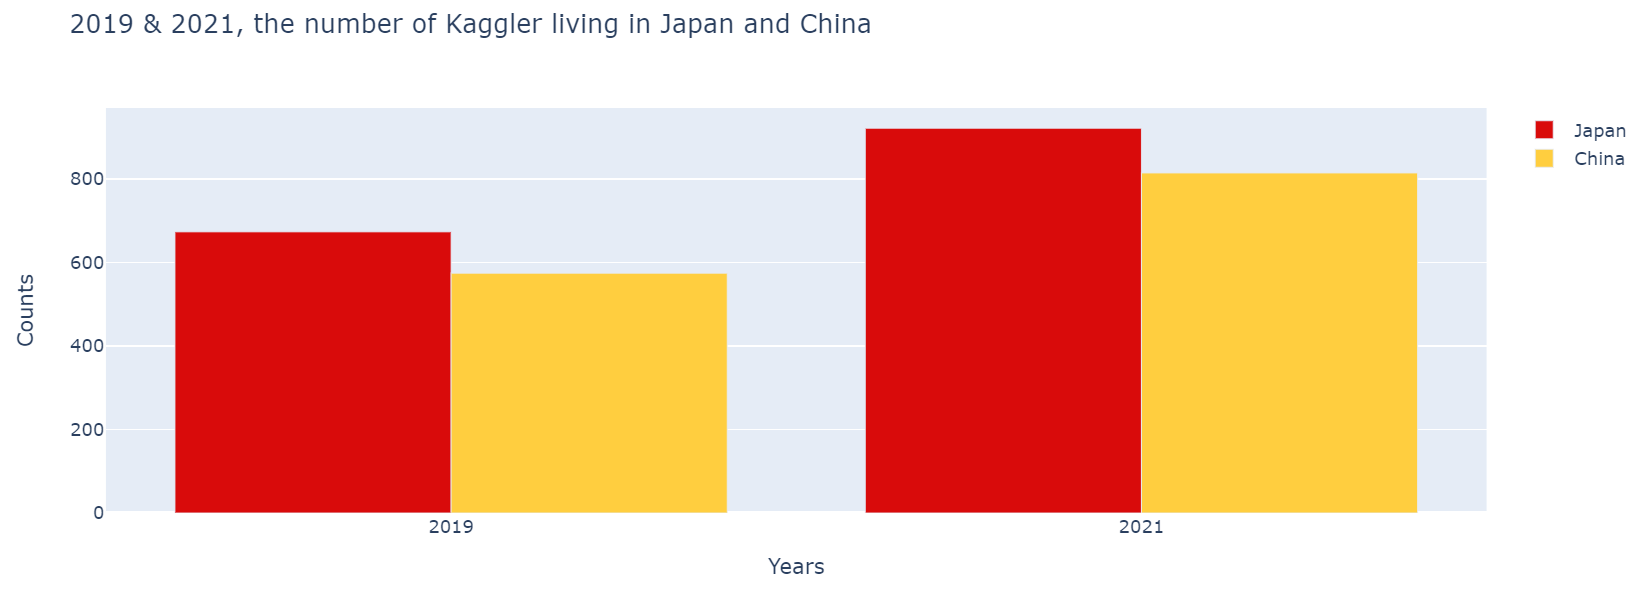
연도별 일본과 중국의 캐글러 수

2019년과 2021년 일본과 중국 캐글러의 수를 비교한 막대그래프이다.
일본은 빨강 중국은 노란색 막대로 표현했으며 일본의 수치가 인구 대비 상당히 높은 걸 알 수 있다.
양국 모두 캐글러의 수치가 증가했다.
2년간 일본은 약 35%, 중국은 약 40%가 증가했으며 증가한 캐글러의 수는 일본이 높지만 비율은 중국이 앞섰다.

Q14. What data visualization libraries or tools do you use on a regular basis?


1
2
3
4
5
6
7
8
9
10
11
12
13
14
15
16
17
18
19
20
21
22
23
24
25
26
27
28
29
30
31
32
33
34
35
36
37
38
39
40
41
42
43
df19_JP = df19[df19.Q3.isin(['Japan'])]
df19_CN = df19[df19.Q3.isin(['China'])]
df21_JP = df21[df21.Q3.isin(['Japan'])]
df21_CN = df21[df21.Q3.isin(['China'])]
df19_JP_Q14 = pd.DataFrame()
df19_CN_Q14 = pd.DataFrame()
df21_JP_Q14 = pd.DataFrame()
df21_CN_Q14 = pd.DataFrame()
df19_JP_Q14['Q20'] = [df19_JP[col][1:].value_counts().index[0] for col in df19_JP.columns[97:109]]
df19_CN_Q14['Q20'] = [df19_CN[col][1:].value_counts().index[0] for col in df19_CN.columns[97:109]]
df21_JP_Q14['Q14'] = [df21_JP[col][1:].value_counts().index[0] for col in df21_JP.columns[59:71]]
df21_CN_Q14['Q14'] = [df21_CN[col][1:].value_counts().index[0] for col in df21_CN.columns[59:71]]
df19_JP_Q14['counts'] = [df19_JP[col][1:].value_counts().values[0] for col in df19_JP.columns[97:109]]
df19_CN_Q14['counts'] = [df19_CN[col][1:].value_counts().values[0] for col in df19_CN.columns[97:109]]
df21_JP_Q14['counts'] = [df21_JP[col][1:].value_counts().values[0] for col in df21_JP.columns[59:71]]
df21_CN_Q14['counts'] = [df21_CN[col][1:].value_counts().values[0] for col in df21_CN.columns[59:71]]

df19_JP_Q14.index = [3,0,6,4,5,2,7,1,8,9,10,11]
df19_CN_Q14.index = [3,0,6,4,5,2,7,1,8,9,10,11]
df19_JP_Q14 = df19_JP_Q14.sort_index()
df19_CN_Q14 = df19_CN_Q14.sort_index()
df21_JP_Q14['Q14'].index = [0,1,2,3,4,5,6,7,8,9,10,11]
df21_CN_Q14['Q14'].index = [0,1,2,3,4,5,6,7,8,9,10,11]
df19_JP_Q14.replace(regex = 'D3.js', value = 'D3 js', inplace = True)
df19_CN_Q14.replace(regex = 'D3.js', value = 'D3 js', inplace = True)

fig_T = make_subplots(rows=1, cols=2, specs=[[{'type':'xy'}, {'type':'xy'}]])

fig_T.add_trace(go.Bar(name=coun_years[0], x=df19_JP_Q14['Q20'].values, y=df19_JP_Q14['counts'], marker_color=coun_years_colors[0]),1,1)
fig_T.add_trace(go.Bar(name=coun_years[1], x=df19_CN_Q14['Q20'].values, y=df19_CN_Q14['counts'], marker_color=coun_years_colors[1]),1,1)
fig_T.add_trace(go.Bar(name=coun_years[2], x=df21_JP_Q14['Q14'].values, y=df21_JP_Q14['counts'], marker_color=coun_years_colors[2]),1,2)
fig_T.add_trace(go.Bar(name=coun_years[3], x=df21_CN_Q14['Q14'].values, y=df21_CN_Q14['counts'], marker_color=coun_years_colors[3]),1,2)

fig_T.update_layout(title_text='2019 & 2021, Visualization Library and Tools in Use',
showlegend=True,
autosize=True)

fig_T.update_xaxes(title_text='2019 Library and Tools', row=1, col=1)
fig_T.update_yaxes(title_test='Counts', row=1, col=1)
fig_T.update_xaxes(title_text='2021 Library and Tools', row=1, col=2)
fig_T.update_yaxes(title_text='Counts', row=1, col=2)

fig_T.show()

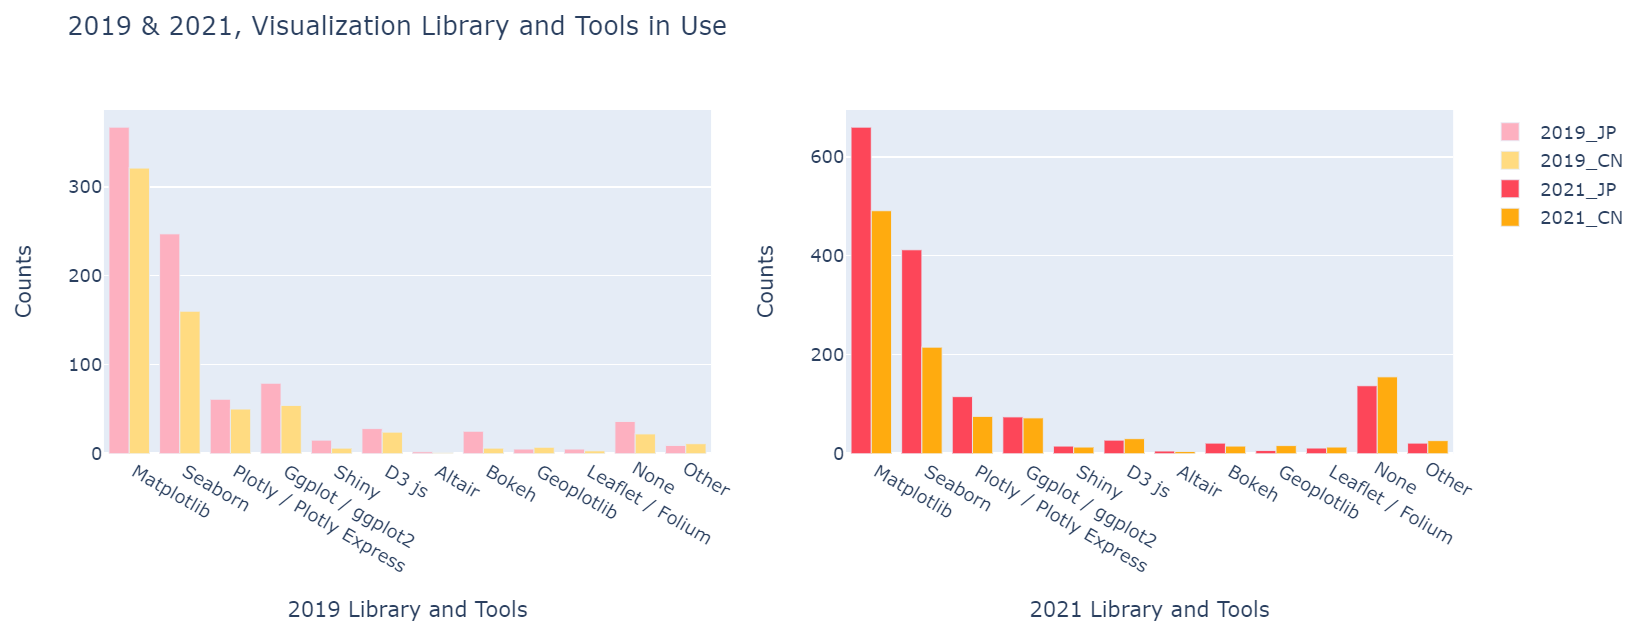
연도별 일본과 중국의 시각화 라이브러리 & 툴 사용 그래프

각 그래프를 연도로 나누고 그래프에는 그에 해당하는 라이브러리,툴 사용량을 국가별로 나누어 넣은 막대그래프이다.
양국 모두 전반적으로 증가하였으나 눈에띄는 부분은 중국의 None항목이 크게 늘었고, 중국은 모든 항목의 사용량이 증가한 반면에 일본은 감소세가 보이는 항목이 있었다.

Q16. Which of the following machine learning frameworks do you use on a regular basis?


1
2
3
4
5
6
7
8
9
10
11
12
13
14
15
16
17
fig_F = make_subplots(rows=1, cols=2, specs=[[{'type':'xy'}, {'type':'xy'}]])

fig_F.add_trace(go.Bar(name=coun_years[0], x=df19_JP_Q16['Q28'].values, y=df19_JP_Q16['counts'].sort_values(ascending=False).values, marker_color=coun_years_colors[0]),1,1)
fig_F.add_trace(go.Bar(name=coun_years[1], x=df19_CN_Q16['Q28'].values, y=df19_CN_Q16['counts'].sort_values(ascending=False).values, marker_color=coun_years_colors[1]),1,1)
fig_F.add_trace(go.Bar(name=coun_years[2], x=df21_JP_Q16['Q16'].values, y=df21_JP_Q16['counts'].sort_values(ascending=False).values, marker_color=coun_years_colors[2]),1,2)
fig_F.add_trace(go.Bar(name=coun_years[3], x=df21_CN_Q16['Q16'].values, y=df21_CN_Q16['counts'].sort_values(ascending=False).values, marker_color=coun_years_colors[3]),1,2)

fig_F.update_layout(title_text='2019 & 2021, Machine Learning Frameworks in Use',
showlegend=True,
autosize=True)

fig_F.update_xaxes(title_text='2019 Machine Learning Frameworks', row=1, col=1)
fig_F.update_yaxes(title_text='Counts', row=1, col=1)
fig_F.update_xaxes(title_text='2021 Machine Learning Frameworks', row=1, col=2)
fig_F.update_yaxes(title_text='Counts', row=1, col=2)

fig_F.show()

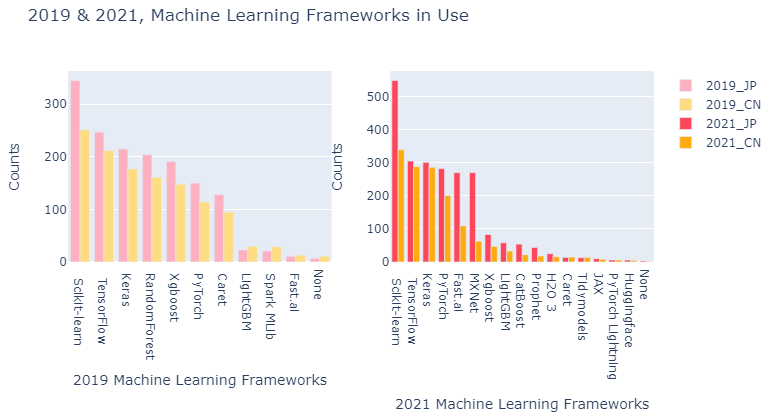
연도별 일본과 중국의 머신러닝 프레임워크 사용 그래프

이번 질문에대한 답도 비슷하다. 그래프는 연도로 나누고 각각의 x축에는 사용하는 머신러닝 프레임워크, y축에는 그 수가 표기되어 얼마나 많은 캐글러가 머신러닝 프레임워크를 사용하지는 나타낸다.
각 년도의 차이점은 (프레임워크의 사용자의 수는 물론이거니와)프레임워크의 종류가 19년도에 비해 21년에 약증했다는 점이 있고, 특이점이라면 21년 일본의 사이킷런Scikit-learn 사용자의 수가 급증했다는 점이 있다.

Author

WJ

Posted on

2021-11-19

Updated on

2021-11-24

Licensed under

You need to set install_url to use ShareThis. Please set it in _config.yml.
You forgot to set the business or currency_code for Paypal. Please set it in _config.yml.

Comments

You forgot to set the shortname for Disqus. Please set it in _config.yml.